The Only User Experience Metrics Guide You Need in 2026 to Measure UX Success & ROI
Learn which user experience metrics matter most, how to measure UX success, prove UX ROI, & build a data-driven UX measurement strategy.
July 08, 2026
Written by

Introduction
Most organizations don't struggle because they lack data. They struggle because they measure the wrong things.
Teams proudly present usability scores, satisfaction surveys, and dashboard reports. Decision-makers listen, then ask a different question: How did this improve revenue, reduce costs, or increase retention? When that connection isn't clear, user experience often becomes one of the first areas to face budget scrutiny.
This is why choosing the right user experience metrics has become a strategic business decision rather than a design exercise. A good dashboard doesn't just tell you how users feel about your product. It helps explain why customers stay, why they leave, and where your next investment should go.
The challenge has only become more complex. AI-powered experiences, enterprise platforms, and increasingly demanding users have made traditional UX measurement insufficient on its own.
In this guide, you'll learn how to measure UX success in a way that aligns with business outcomes. Also, it'll guide you on choosing the right measurement framework for your product & build a measurement system that supports better decisions over time.
Throughout this guide, we'll also share patterns we've consistently observed while helping organizations measure and improve digital experiences. In many cases, the challenge isn't collecting more data. It's identifying the few metrics that actually influence product and business decisions.
Why Great User Experiences Still Fail to Win Executive Support
Many UX teams face the same challenge. A redesign improves usability, customer testing is positive, and support ticket numbers decline. Yet leadership still questions the value of investing in UX when discussing budgets.
Recent research shows that while 9 in 10 executives believe customer loyalty has improved, only 4 in 10 customers agree. At the same time, 52% of consumers stop buying from a brand after just one bad experience. The gap between perception and reality often exists because organizations rely on assumptions instead of measurable insights.
This is where many UX initiatives lose executive support. Teams present usability scores and satisfaction ratings, while leadership wants to understand business outcomes such as customer retention, product adoption, and operational efficiency.
A better interface doesn't automatically translate into business value. A higher usability score doesn't guarantee stronger retention, and positive survey results don't always lead to revenue growth.
In fact, one pattern we've consistently seen is that executives rarely question UX itself. They question whether its impact can be measured. If your team can connect UX improvements to business outcomes, it earns far stronger organizational support than those reporting usability scores alone.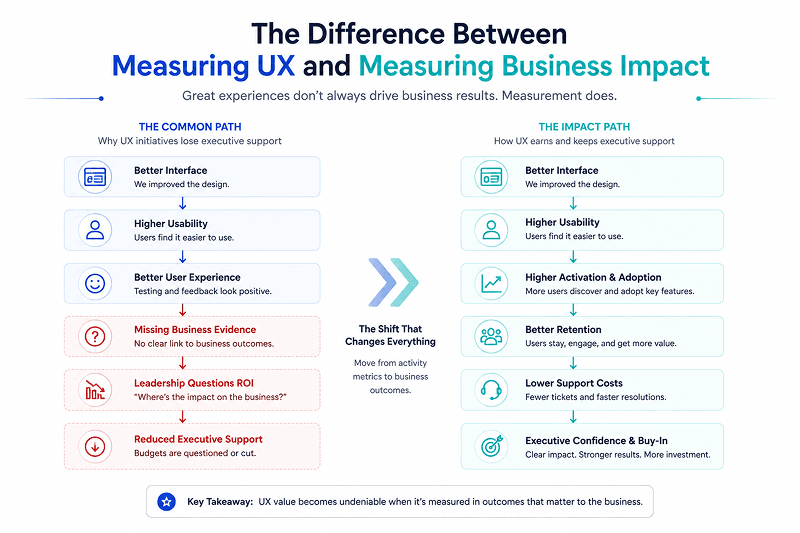
Why UX Metrics Alone Rarely Convince Decision Makers
One of the fastest ways to lose the attention in the boardroom is to present UX metrics without business context.
Imagine a quarterly review where the UX team reports:
- System Usability Scale increased from 71 to 79.
- Task completion improved by 12%.
- Average satisfaction score rose to 4.5 out of 5.
These are meaningful improvements, but they rarely answer the question leadership is actually asking: "What changed for the business?"
One question Millipixels often encourages teams to ask is, "What business decision does this metric help us make?" That single question usually eliminates half the metrics on a typical dashboard and keeps discussions focused on outcomes instead of reporting.
This is where many organizations confuse the following three different types of measurement.
| Measurement Type | Answers the Question | Example |
| UX Metrics | Is the experience improving? | Task Success Rate, SUS, Error Rate |
| Product KPIs | Is the product achieving its goals? | Activation Rate, Feature Adoption, Retention |
| Business Outcomes | Is the company creating value? | Revenue Growth, Customer Lifetime Value, Profitability |
Treating these as interchangeable creates two problems.
First, UX teams struggle to justify investment because their metrics stop at the product layer. Second, executives dismiss valuable UX insights because they cannot see how they influence strategic objectives.
Every UX Metric Should Answer a Business Question
Before selecting a metric, ask what decision it is supposed to support. For example:
| Business Question | UX Metric | Business Outcome |
| Why are users abandoning onboarding? | Task Success Rate | Higher activation |
| Why is support volume increasing? | Error Rate | Lower support costs |
| Why are enterprise users not adopting a feature? | Time on Task | Increased feature adoption |
| Why are renewal rates declining? | Customer Satisfaction | Improved retention |
This approach changes the purpose of measurement. Instead of just collecting numbers because they are easy to track, teams collect evidence that helps prioritize investments. It also changes conversations with leadership.
Rather than saying:
"Our SUS score improved by eight points."
You can explain:
"Improving usability reduced onboarding friction, increased activation, and shortened time to value for new customers."
The Business Case for Measuring UX Properly
The connection between user experience and financial performance is no longer theoretical.
McKinsey's multi-year study of 300 publicly listed companies found that organizations with the strongest design capabilities achieved 32% higher revenue growth and 56% higher total returns to shareholders than industry peers.
They did not gain advantage from aesthetics alone. These companies consistently measured customer needs, validated decisions with evidence, and identified user friction before it translated into problems like high bounce rates and lost conversions.
Is Your UX Measurement Strategy Helping or Holding Your Product Back?
Consult MillipixelsStop Choosing UX Metrics Before You Know What Decision You're Making
Search for UX metrics, and you'll find hundreds of options: Task Success Rate, Net Promoter Score, Customer Satisfaction, Time on Task, Error Rate, Retention, Feature Adoption, Engagement, System Usability Scale, and the list keeps growing.
This abundance creates the illusion that better measurement means tracking more metrics. In reality, experienced product teams do the opposite. They begin with the decision they need to make, then identify the smallest set of metrics that can support that decision. That sounds obvious, but it changes everything.
The Same Metric, Different Decisions
Consider two organizations using the exact same product. One wants to improve customer onboarding. The other wants to reduce enterprise support costs.
Both may track Task Success Rate, but the decision behind the metric changes its meaning. For the first company, the metric indicates whether new users can reach value quickly. For the second, it highlights workflows that generate unnecessary support requests.
The metric is identical. The business decision is not. In fact, we've found that the most effective dashboards usually contain fewer metrics than teams initially expect. Reducing measurement complexity often leads to faster and more confident product decisions.
That's why copying another company's UX dashboard rarely works. A metric only becomes valuable when it reduces uncertainty around a specific decision.
Start With the Question, Not the Metric
Before adding any metric to your dashboard, ask: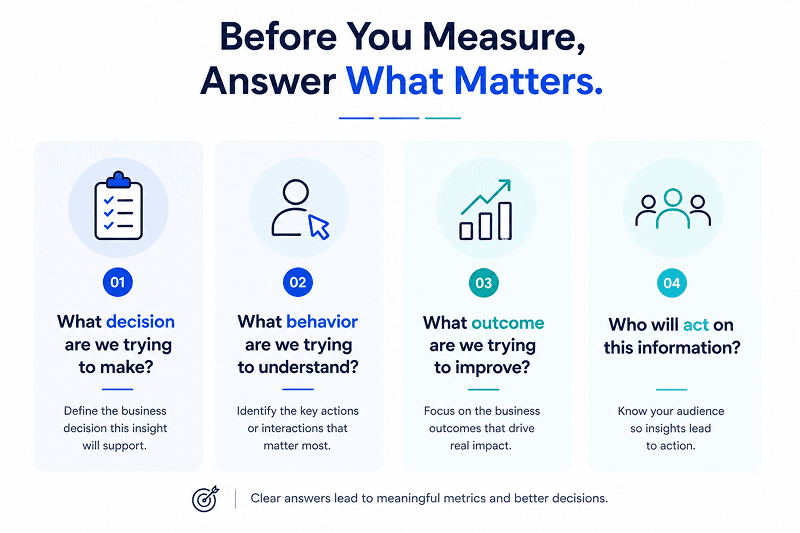
If none of those questions has a clear answer, the metric probably doesn't belong on your dashboard.
The best UX dashboards are surprisingly small. They prioritize clarity over completeness and help teams act, not simply observe.
In the next section, we'll build on this decision-first approach by exploring why the right measurement framework depends less on the metric itself and more on the type of product you're building.
Not Every UX Measurement Framework Is Built for Your Product
Most UX measurement guides start by introducing a framework. The better question is whether that framework fits the product you're building.
A consumer-facing mobile app, an internal employee portal, and an AI coding assistant all create value in different ways. Measuring them with the same framework can produce misleading insights.
Before choosing metrics, identify the product's primary objective. Once you know what success looks like, selecting a measurement framework becomes much simpler.
Start With Your Product, Not the Framework
| Product Type | Primary Goal | Recommended Framework | Why It Fits |
| Consumer SaaS | Engagement and retention | HEART | Balances behavioral and attitudinal metrics to understand overall user experience. |
| Marketplace | Growth and activation | AARRR | Focuses on acquisition, activation, retention, referral, and revenue across the customer lifecycle. |
| B2B SaaS | Adoption and long-term value | HEART + Product KPIs | Combines usability with adoption, expansion, and retention metrics. |
| Enterprise Software | Workflow efficiency | HEART + CASTLE | Measures whether employees can complete business-critical tasks with minimal friction. |
| Internal Tools | Productivity and operational efficiency | CASTLE | Prioritizes task completion, efficiency, and organizational outcomes over engagement. |
| AI Products | Trust and successful collaboration | HEART + Emerging AI Metrics | Traditional usability metrics need to be complemented with trust and AI-specific success signals. |
One of the biggest mistakes organizations make is assuming every product should optimize for engagement.
For consumer products, engagement often signals value. For enterprise software, the opposite can be true. If employees spend more time completing expense reports or procurement approvals, that isn't higher engagement; it's inefficiency.
This is where Nielsen Norman Group's CASTLE framework becomes useful. Developed specifically for enterprise and internal software, CASTLE evaluates products across six dimensions: Customer, Activity, Scope, Technology, Lifecycle, and Environment.
Rather than measuring how much time users spend in the product, it examines whether the software helps employees complete meaningful work efficiently. In many cases, the best enterprise experiences are the ones users barely notice because the design quietly removes friction.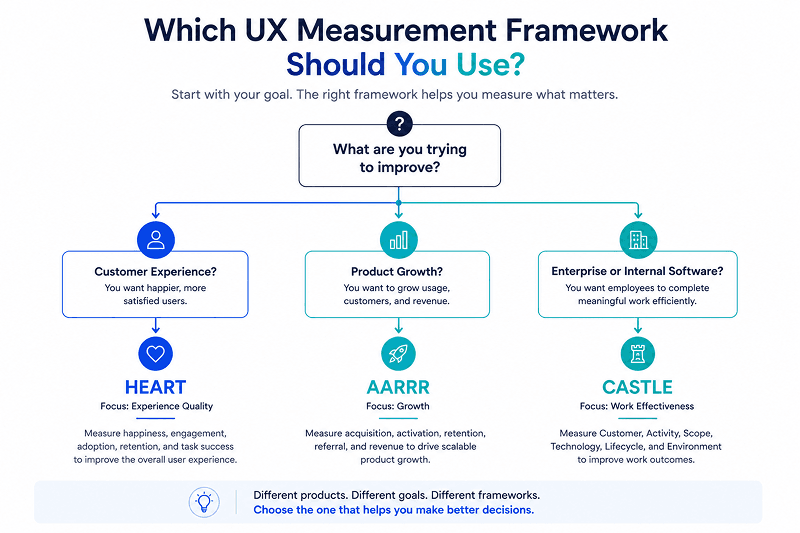
That distinction matters because enterprise software succeeds when it becomes almost invisible. Users shouldn't need to think about the interface. They should simply accomplish their work. In these environments, effectiveness is often a more meaningful measure of success than engagement.
You Don't Need 70+ User Experience Metrics, Just the Ones That Answer the Right Questions
It's easy to feel overwhelmed by the number of UX metrics available today. Some resources list more than 70+ different ways to measure user experience. Most organizations don't need seventy. They need a handful of metrics that answer their most important product questions.
Before You Trust Any UX Metric, Ask: "Compared to What?"
A Task Success Rate of 82% might sound impressive. A System Usability Scale score of 75 may appear acceptable. But are they actually good?
Without context, numbers become difficult to interpret. This is why benchmarking matters.
Rather than relying on arbitrary targets, UX teams should evaluate metrics against established grading scales, industry benchmarks, or competitor studies, or other similar baselines. A score only becomes meaningful when compared with previous performance, industry benchmarks, competitor studies, or similar products.
The UX Metrics That Matter Most
| Metric | Definition | Formula | Best Used For | Common Mistake | Business Impact |
| Task Success Rate | Percentage of users who successfully complete a task | Successful Tasks ÷ Total Attempts × 100 | Evaluating usability of key workflows | Measuring simple tasks instead of business-critical ones | Higher activation and lower abandonment |
| Time on Task | Time users take to complete a task | Total Completion Time ÷ Number of Users | Identifying friction in workflows | Assuming faster is always better | Improved productivity and reduced operational costs |
| Error Rate | Frequency of user errors during task completion | Errors ÷ Opportunities for Error × 100 | Finding usability bottlenecks | Counting minor mistakes that have little business impact | Lower support costs and higher task completion |
| System Usability Scale (SUS) | Standardized questionnaire measuring perceived usability | Calculated from ten survey responses | Comparing usability over time | Treating SUS as a standalone measure of success | Easier prioritization of UX improvements |
| Customer Satisfaction (CSAT) | User satisfaction after completing an interaction | Positive Responses ÷ Total Responses × 100 | Evaluating specific touchpoints | Surveying too infrequently | Better customer retention |
| Net Promoter Score (NPS) | Measures customer willingness to recommend a product | % Promoters minus % Detractors | Measuring long-term loyalty | Using NPS to diagnose usability problems | Stronger advocacy and repeat business |
| Conversion Rate | Percentage of users completing a desired action | Conversions ÷ Visitors × 100 | Marketing and product optimization | Ignoring user quality | Increased revenue and activation |
| Retention Rate | Percentage of users who continue using the product | Returning Users ÷ Total Users × 100 | Product health and long-term engagement | Measuring too short a time period | Higher lifetime value and recurring revenue |
There Is No Universal Set of UX Metrics
The most effective user experience metrics depend on what you're trying to achieve. A consumer app focused on engagement won't measure success the same way as an enterprise platform designed to improve employee productivity. Likewise, an AI assistant requires different success signals than a traditional web application.
Rather than asking, "Which UX metrics should we track?", the better question to ask is, "What business decision are we trying to make?" The answer should determine your measurement strategy. The right metrics are the ones that help you evaluate progress, identify friction, and make better product decisions, not the ones that appear on every industry checklist.
AI Is Changing User Experience. So Why Are We Measuring It the Same Way?
Most UX metrics were designed for traditional interfaces where users followed predictable workflows. AI changes that model.
Whether you're building a customer support copilot, an enterprise knowledge assistant, or an agentic workflow, success is no longer defined by task completion alone. It also depends on the quality of AI-generated outcomes and how often users need to correct or intervene.
Two AI assistants may help users complete the same task in the same amount of time, yet deliver very different experiences. One produces accurate, usable responses. The other requires repeated edits and retries.
Traditional UX metrics would treat them as equally successful, even though their real-world value is vastly different. Without measuring the right signals, these experience gaps can become UX design mistakes that negatively impact conversion rates.
Emerging UX Signals for AI Products
As AI becomes part of everyday workflows, product teams should begin tracking signals that traditional dashboards often overlook.
| Emerging AI UX Metric | Why It Matters | Example |
| Successful AI Task Completion Rate | Measures whether users complete their intended task with AI assistance | What percentage of AI-assisted tasks are completed successfully without abandoning the workflow? |
| Human Intervention Rate | Shows how often users must edit, override, or retry AI outputs | How many AI responses require manual correction before they can be used? |
| Recovery Rate After AI Errors | Measures how easily users recover when AI produces an incorrect response | Can users successfully complete the task after an AI mistake? |
| AI Response Acceptance Rate | Indicates how often users accept AI-generated suggestions without modification | What percentage of AI recommendations are accepted as-is? |
| Time to Successful Outcome | Measures how quickly users achieve their goal with AI assistance | Does AI reduce the time required to complete a business task compared to the previous workflow? |
These metrics are still evolving, and there is no universally accepted framework yet. Unlike traditional UX, AI experiences introduce variables such as model accuracy, human oversight, and response quality. Rather than relying on a single score, organizations should combine traditional UX metrics with AI-specific operational metrics to understand whether AI is genuinely improving the user experience.
A practical recommendation is to pair traditional usability metrics with AI-specific indicators during product reviews. For example:
- Track Task Success Rate alongside Human Intervention Rate.
- Measure CSAT alongside User Trust.
- Monitor Time on Task together with Recovery After AI Errors.
This combination provides a more realistic picture of how people work with AI instead of simply measuring whether they completed a workflow.
In fact, at Millipixels, what we have seen across AI-enabled products is that trust often becomes the bottleneck before usability does. Users may understand how to use an AI feature but still avoid it if they cannot predict its behavior. Improving transparency, confidence, and recovery often creates greater business impact than making the interface visually simpler.
How High-Performing Teams Turn UX Metrics Into Better Decisions
Collecting metrics is relatively easy. Building a measurement system that consistently improves products is much harder. High-performing product organizations don't treat UX measurement as a quarterly reporting exercise. They make it part of their operating rhythm.
One pattern appears consistently across successful teams: they measure with intention, review regularly, and remove metrics that no longer influence decisions.
The Millipixels Decision-First UX Measurement Model
Instead of tracking dozens of disconnected metrics, build your measurement strategy around a clear objective. One framework we've found particularly effective follows this sequence: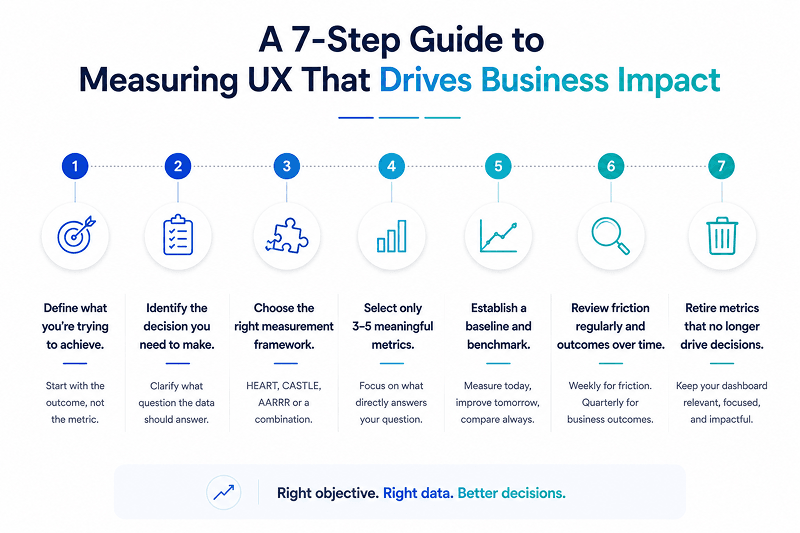
Step 1: Define what you're trying to achieve.
Start with the outcome, not the metric. For example, are you trying to improve onboarding, increase feature adoption, reduce support costs, improve employee productivity, or demonstrate the ROI of UX? Your objective should determine everything that follows.
Step 2: Identify the decision you need to make.
Once your objective is clear, the next step is to ask what decision the data should support. For example, do you need to identify friction in onboarding, understand why adoption is low, or evaluate whether a redesign delivered measurable business value?
Step 3: Choose the right measurement framework.
Select a framework that fits your product and objective. Choose between HEART, CASTLE, and AARRR, depending on your strategy, decision context, and product category. And in many cases, combining frameworks provides the best measurement view.
Step 4: Select only three to five meaningful metrics.
Choose the UX performance metrics that directly answer your business question. A focused dashboard is easier to maintain, easier to communicate, and far more actionable than one filled with dozens of disconnected metrics.
Step 5: Establish a baseline and benchmark your results.
Record current performance before making changes and compare future results against historical performance or industry benchmarks. Metrics without context rarely lead to good decisions.
Step 6: Review friction regularly and business outcomes over time.
Monitor usability issues such as task failures, navigation problems, or AI intervention rates frequently. To understand the long-term impact, do a quarterly review of the business outcomes, including activation, retention, customer satisfaction, and operational efficiency.
Step 7: Retire metrics that no longer drive decisions.
As products evolve, your measurement strategy should evolve too. If a metric no longer influences priorities or product decisions, remove it. Every metric on your dashboard should have a clear purpose and an owner.
How Millipixels Turned UX Metrics Into Measurable Business Results
This measurement-first approach reflects how we work with clients at Millipixels. One example is our work with Stanfield.
Millipixels applied the same principles while helping Stanfield modernize an eCommerce platform serving more than 5,000 school districts.
We didn't start with metrics. Instead with started with the business objective, which was to create a faster, more intuitive purchasing experience that would improve conversions while reducing support effort across desktop and mobile.
Following a UX audit and user research, we identified friction in key purchasing journeys and redesigned the experience around measurable outcomes. Instead of tracking every available metric, we focused on the ones that reflected success for the business, including conversion, mobile engagement, and support intervention.
The results demonstrated the value of a focused measurement strategy:
- 23% increase in conversions within the first month after launch
- 30% reduction in support intervention
- 40% improvement in mobile engagement
These improvements were a result of measuring the right metrics. We validated design decisions with data and refined the experienced continuously, based on real user behaviour. This ultimately enabled us to make better decisions and deliver a positive business impact.
See How a Measurement-First UX Approach Improved Conversions, Engagement, and Efficiency
Read the Case StudyConclusion: Choosing User Experience Metrics That Matter
The biggest takeaway is simple: there is no universal approach to user experience metrics.
The right metrics depend on the product you're building, the decisions you're trying to make, and the outcomes you want to improve. As digital products evolve from traditional interfaces to AI-powered experiences, your measurement strategy should evolve too.
The best product teams are not the ones that measure more. They measure what really matters. Add to it choosing the right framework, benchmarking performance, and using user experience metrics to make product decisions. The result is a great customer experience and positive business outcomes.
At Millipixels, we help organizations build UX measurement strategies that connect user experience metrics with real business impact. Whether you're designing a SaaS platform, enterprise software, or an AI-powered product, we help you measure what truly matters.
Want to build a UX measurement strategy that supports smarter product decisions? Connect with Millipixels and let's create a framework tailored to your product and goals.
Frequently Asked Questions
1. What are the most important user experience metrics to track?
The most important metrics for user experience are Task Success Rate, Time on Task, Error Rate, System Usability Scale (SUS), Customer Satisfaction (CSAT), Net Promoter Score (NPS), Conversion Rate, and Retention Rate. The right metrics will depend on your product goals and the business decisions you are trying to inform.
2. What are UX KPI metrics?
UX KPI metrics are quantifiable values that enable you to determine whether your user experience is helping you meet larger product or business objectives. Examples include: onboarding completion, feature usage, retention, customer satisfaction and task completion. Unlike standalone UX metrics, KPIs are directly linked to things like customer retention, revenue growth, or operational efficiency.
3. What is ROI in UX design?
The ROI of UX design is a way to measure how much business value you get from improvements in user experience versus what you spend to make those improvements. This value can come from increased conversions, improved customer retention, lower support costs, improved productivity, or faster product adoption.
4. How can I effectively measure user experience in my project?
Get started with identifying the business decision you want to improve, not the metric you want to track. Choose a small set of relevant UX success metrics, set up a baseline, and measure progress over time against benchmarks. Combining behavioral data, such as Task Success Rate and Error Rate, with attitudinal data, such as CSAT or SUS, provides a more complete view of the user experience.
One of the most effective approaches is to connect UX findings to business outcomes. For example, improvements in onboarding usability should ideally lead to higher activation, while fewer usability issues should reduce support requests. This approach to measuring UX and ROI helps demonstrate how user experience contributes to product performance and business growth.
5. What are the most important UX metrics and KPIs to track?
The most common UX performance metrics and KPIs are Task Success Rate, Time on Task, Error Rate, SUS, CSAT, NPS, Conversion Rate, Feature Adoption, and Retention Rate. Don’t try to track all of them. Stick to the few that are most helpful for your current business objectives.
6. How do UX metrics influence design decisions?
UX metrics help teams identify friction, validate design improvements, prioritize product investments, and measure the impact of changes. They replace assumptions with evidence, enabling more confident design and product decisions.
7. How can I measure the ROI of my UX design projects effectively?
Start by defining the business outcome you want to influence, such as increasing conversions, reducing support costs, improving retention, or shortening onboarding time. Measure performance before and after UX improvements, then compare the business impact against the cost of the initiative. This structured approach provides a more reliable view of ROI UX design than relying on usability scores alone.
Keep in mind that not every UX improvement delivers immediate financial returns. Some initiatives reduce future development costs, decrease customer churn, or improve operational efficiency over time. Looking beyond short-term revenue provides a more accurate picture of the overall return on UX investment.
8. Can you provide examples of successful UX ROI calculations?
A simple example is redesigning an onboarding flow that increases activation from 60% to 75%. If more activated users become paying customers, the additional revenue can be compared with the cost of the redesign to calculate ROI. Other examples include reduced support costs, fewer software defects, or improved employee productivity.
9. Which tools can I use to measure user experience?
Common tools include product analytics platforms, session replay software, user testing platforms, heatmaps, and customer feedback tools. The best results come from combining quantitative analytics with qualitative user research rather than relying on a single tool.
Written by

Parthsarathy Sharma
With 4+ years of experience across AI, UX, GCC/outsourcing, enterprise technology, and brand strategy, Parthsarathy brings a research-driven lens to digital experience content. His work focuses on turning emerging technology, customer experience, and business trends into clear, practical perspectives for readers.
Reviewed by

Sumeet Kaur
With close to 20 years of experience in the technology industry, notably with organisations like Dell, Sumeet has been a pillar of strength for the team with her role in overseeing multiple initiatives and leading the content space with our marketing leadership team.
- Introduction
- Why Great User Experiences Still Fail to Win Executive Support
- Why UX Metrics Alone Rarely Convince Decision Makers
- Stop Choosing UX Metrics Before You Know What Decision You're Making
- Not Every UX Measurement Framework Is Built for Your Product
- You Don't Need 70+ User Experience Metrics, Just the Ones That Answer the Right Questions
- AI Is Changing User Experience. So Why Are We Measuring It the Same Way?
- How High-Performing Teams Turn UX Metrics Into Better Decisions
- How Millipixels Turned UX Metrics Into Measurable Business Results
- Conclusion: Choosing User Experience Metrics That Matter
- Frequently Asked Questions